Lima-memtester
Introduction
The lima-memtester diagnostic program is one of the Hardware Reliability Tests, which is used to verify correctness of the DRAM configuration settings in U-Boot.
An example of usage (detecting reliability problems):
# ./lima-memtester 1400M
This is a simple textured cube demo from the lima driver and
a memtester. Both combined in a single program. The mali400
hardware is only used to stress RAM in the background. But
this happens to significantly increase chances of exposing
memory stability related problems.

memtester version 4.3.0 (32-bit)
Copyright (C) 2001-2012 Charles Cazabon.
Licensed under the GNU General Public License version 2 (only).

pagesize is 4096
pagesizemask is 0xfffff000
want 1400MB (1468006400 bytes)
got  1400MB (1468006400 bytes), trying mlock ...locked.
Loop 1:
  Stuck Address       : ok
  Random Value        : ok
  Compare XOR         : ok
  Compare SUB         : ok
  Compare MUL         : ok
  Compare DIV         : ok
  Compare OR          : ok
  Compare AND         : ok
  Sequential Increment: ok
  Solid Bits          : testing  23FAILURE: 0xffffffff != 0xffffff00 at offset 0x099e03bc.
FAILURE: 0x00000000 != 0x000000ff at offset 0x099e03c0.
FAILURE: 0xffffffff != 0xffffff00 at offset 0x099e03c4.
FAILURE: 0x00000000 != 0x000000ff at offset 0x099e03c8.
Using lima-memester as a normal application
If you have a linux system running on the device with a suitable kernel (has the framebuffer driver and mali r3pX version of the kernel driver), then you can run the lima-memtester program on it directly. See Hardware Reliability Tests#DRAM for more details.
Using lima-memester as a part of FEL bootable image
For Orange Pi PC see https://github.com/ssvb/lima-memtester/releases/tag/20151207-orange-pi-pc-fel-test
Results analysis
A question at stats.stackexchange.com: http://stats.stackexchange.com/questions/218691/exact-multinomial-goodness-of-fit-test-as-a-normality-test-and-chebyshevs-inequ
Using the Xunlong Orange Pi PC data as an example:
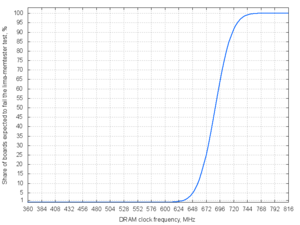
Analysing the first 6 reported results:
echo '672 672 648 672 720 672' | lima-memtester-genchart 12 chart.png
| DRAM clock speed | Share of boards expected to fail the lima-memtester test |
|---|---|
| 600 MHz | 0.01 % |
| 624 MHz | 0.33 % |
| 648 MHz | 4.50 % |
| 672 MHz | 24.89 % |
| 696 MHz | 63.27 % |
| 720 MHz | 91.25 % |
| 744 MHz | 99.12 % |
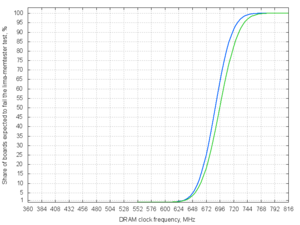
Analysing the first 12 reported results:
echo '672 672 648 672 720 672 672 744 696 696 672 672' | ./lima-memtester-genchart 12 chart.png
| DRAM clock speed | Share of boards expected to fail the lima-memtester test |
|---|---|
| 576 MHz | 0.00 % |
| 600 MHz | 0.01 % |
| 624 MHz | 0.29 % |
| 648 MHz | 3.29 % |
| 672 MHz | 17.88 % |
| 696 MHz | 50.00 % |
| 720 MHz | 82.12 % |
| 744 MHz | 96.71 % |
| 768 MHz | 99.71 % |
Verifying the assumption about having a Gaussian distribution
This can be done via one (or more than one) of the normality test methods. Here is an example of using R for doing this. We can just substitute the data in the 'x' vector by taking the middle of each DRAM clock frequency bin (for example, if lima-memtester passes at 672 MHz and fails at 696 MHz, then take 684 as the average because it is likely a crossover point between passing and failing):
x <- c(684.0, 684.0, 660.0, 684.0, 732.0, 684.0, 684.0, 756.0, 708.0, 708.0, 684.0, 684.0)
Which results in a staircase-alike Q-Q plot and very low p-values (Shapiro-Wilk test: p-value = 0.01275, Kolmogorov-Smirnov test: p-value = 0.117, Anderson-Darling test: p-value = 0.002434). That's because we are dealing with 24 MHz granularity and having many samples with exactly the same value. And normality test methods typically don't like ties very much. We can also randomize the DRAM clock frequencies within each bin in order to get rid of ties (for example, if the test passes at 672 MHz and fails at 696 MHz, then we take some random value between 672 and 696):
x <- c(673.1, 695.6, 652.5, 695.4, 728.3, 682.1, 691.2, 751.2, 713.9, 718.6, 675.2, 690.4)
Which results in a more linear Q-Q plot and much higher p-values (Shapiro-Wilk test: p-value = 0.9411, Kolmogorov-Smirnov test: p-value = 0.7025, Anderson-Darling test: p-value = 0.7469). And this means that we still can't reject the assumption about having the Gaussian (Normal) distribution. There is also a criticism about normality tests, which demonstrates that they do not always behave well and should be taken with a grain of salt.
Exact multinomial test
We can also try to check if the estimated probabilities of encountering different maximum DRAM clock frequencies agree with the experimental results. For doing this, we randomly split the current 13 available DRAM clock frequency samples into a "training set" and a "validation set". The training set is used to calculate the theoretical probabilities of encountering different DRAM clock frequencies (see the "Share of boards expected to fail the lima-memtester test" table). And the validation set is used to check if the practice does not contradict with the theory. Because the number of samples is too small, the classic schoolbook Pearson's chi-squared test can't be used. So instead using Fisher's exact test (or the multinomial test in this particular case) is a much better choice. There is a nice XNomial library for R to do this job.
The training set and the validation sets can be just comma separated in the input data for the lima-memtester-genchart script:
echo '648 672 672 672 672 696 720 744, 672 672 672 696 696' | ./lima-memtester-genchart 12
Example output:
...

> library(XNomial)
>
> prob <- c(0.0007283175419052768, 0.00744356779387656, 0.04317730632627215, 0.14247361868533098, 0.2679071710633351, 0.2873730067728857, 0.17586116428130794, 0.06134920915452913, 0.012180622334238, 0.0013734297459093714)
> observed <- c(0, 0, 0, 0, 3, 2, 0, 0, 0, 0)
> out <- xmulti(observed, prob, detail=3)

P value  (LLR)  =  0.4117
P value (Prob)  =  0.7255
P value (Chisq) =  0.514

Observed:  0 0 0 0 3 2 0 0 0 0
Expected ratio:  0.0007283175 0.007443568 0.04317731 0.1424736 0.2679072 0.287373 0.1758612 0.06134921 0.01218062 0.00137343
Total number of tables:  2002
Below are the results of trying different splits of samples between the training set and the validation set:
| Training set (a sorted list of DRAM clock frequencies) | Validation set (a sorted list of DRAM clock frequencies) | 'xmulti' report from XNomial library for R | ||
|---|---|---|---|---|
| P value (LLR) | P value (Prob) | P value (Chisq) | ||
| 648 672 672 672 672 696 720 744 | 672 672 672 696 696 | 0.4117 | 0.7255 | 0.514 |
| 672 672 672 672 696 696 696 720 | 648 672 672 672 744 | 0.006861 | 0.006352 | 0.01371 |
| 672 672 672 672 672 696 720 744 | 648 672 672 696 696 | 0.7153 | 0.7873 | 0.8832 |
| 672 672 672 672 696 696 720 744 | 648 672 672 672 696 | 0.4332 | 0.4204 | 0.4122 |
| 648 672 672 672 672 696 696 696 | 672 672 672 720 744 | 0.001088 | 0.001039 | 0.0003382 |
| 672 672 672 672 696 696 696 744 | 648 672 672 672 720 | 0.3062 | 0.306 | 0.4315 |
Note that the exact multinomial test rejects our null hypothesis about the estimated DRAM clock speed frequencies distribution in the cases when the 744 MHz sample is not included into the training set. Basically, if 744 MHz is not present in the training set, then it gets estimated to have a very low probability. And then encountering it in the validation set is seen as a rather unusual outcome, resulting in a low p-value. Why do we care about this? The 744 MHz is an unusual extreme DRAM clock speed sample, which would not be predicted correctly by only analysing the first 6 reported samples. Fortunately or not, it is an extreme high DRAM clock speed. But if we had an extreme low DRAM clock speed sample instead, then we would have a bit of a problem with our original goal (estimating what is safe to use for U-Boot).
Also having p-value > 0.05 (not failing the test) does not automatically mean that everything is fine. There are some nice explanations in the "Power analysis" section of the Exact test of goodness-of-fit article from the www.biostathandbook.com website. Basically, our number of samples is likely way too small. Power analysis via simulation or some other method should provide the number of required samples.

